Info-Graphics
I have always loved reading, hearing and viewing new ideas. It is one of the things I love most about learning through my PLN. People I have connected with share ideas that resonate with them, and I in turn share them onwards. Something I would like to start doing is not only sharing my original ideas more, but also synthesising the ideas of others through original products, created by me.
I particularly enjoy the infographic. Simply put, it displays information graphically. With visual media much more prevalent both in social networks but also within classrooms, this is a skill I am keen to develop.
And so did.
I have lent my hand to an idea I have found online, and created an infographic to accompany it. The process was elegantly simple, despite my feelings of trepidation prior to beginning. I will share this process below.
First, the idea I found through my networks: Please have a listen (but make sure you read the rest of the post!)
So after hearing this, I felt inspired to pass this on – graduation speeches are often inspirational, but rarely make a lasting impact on me. I wanted to hang on to this idea!
At its core, the creation of an infographic is an exercise in information literacy – it is transferring information from one medium to another. It is also a process that mirrors the research skills I expect from my students, and so I decided to make my process in this exercise visible to them.
- I located the section of the transcript that was relevant to me. The five questions was part of a greater whole, so I needed to discard the sections of text that would not be relevant.
- I read the text and made highlights – identifying the main points and highlighting key passages.
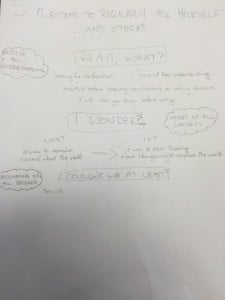
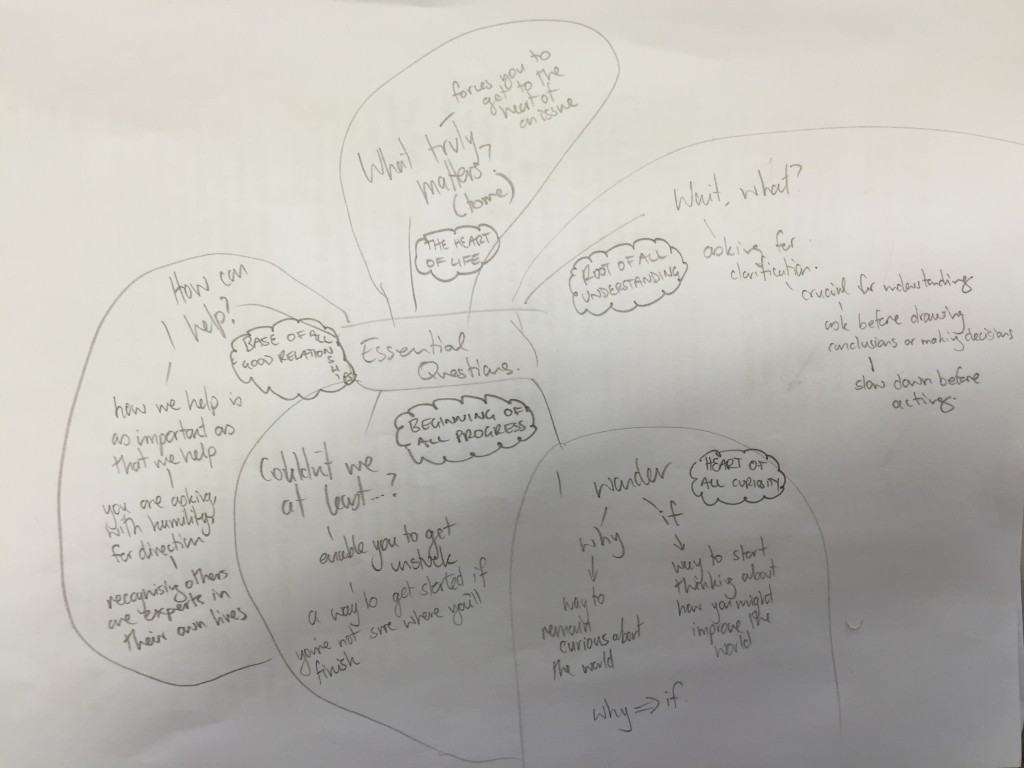
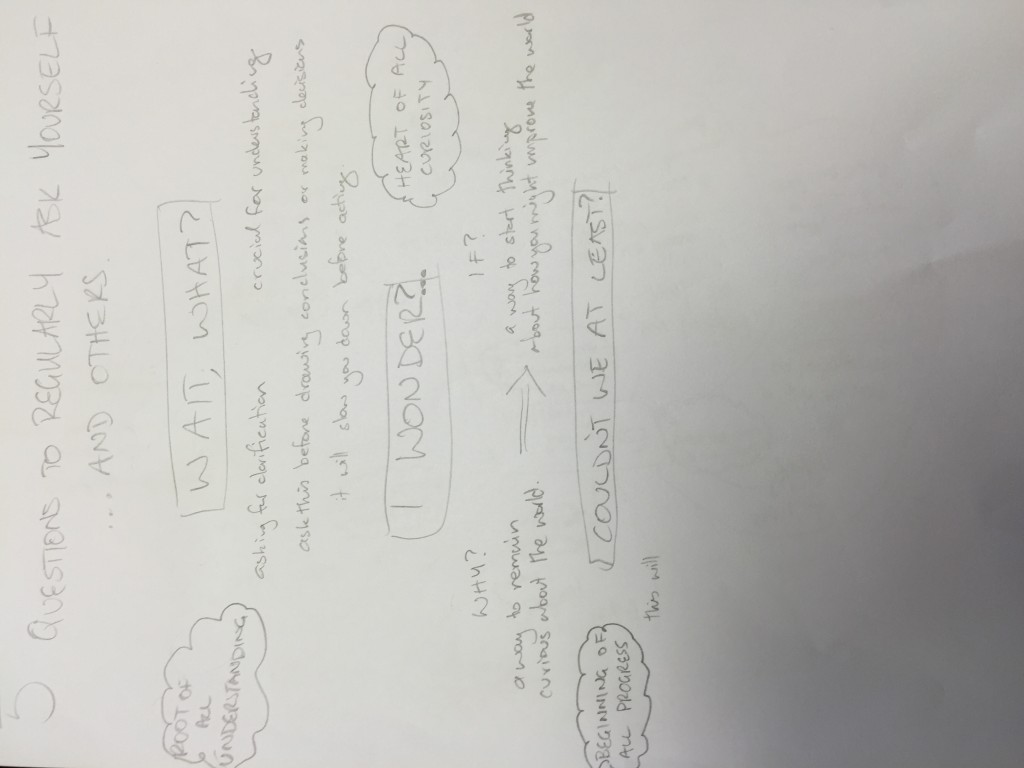
- I transferred these highlights into a mind map, in order to start making sense of the information.
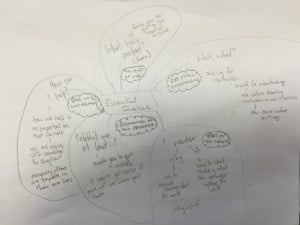
- Translating the mindmap into a draft visual product. This I only got half way through, before deciding I was on the right track.
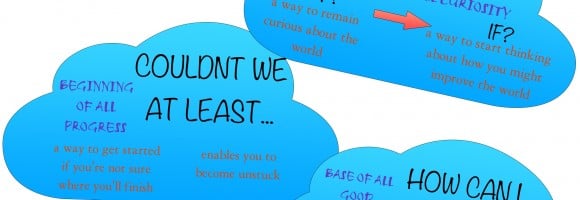
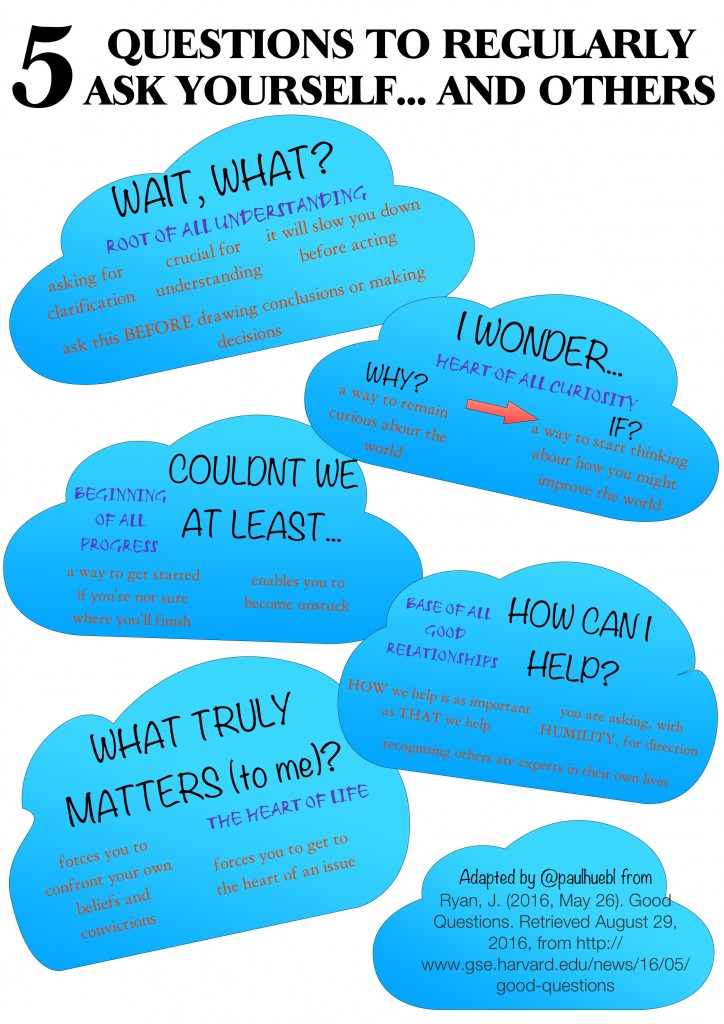
- Completing the layout digitally. I used Pixelmator, but many programs would also work. This is what I ended up with:
On reflection, I am very happy with my first foray into infographic-ing. Even more exciting though, was the paralells I found between my process and the work I have my students do in class. The sharing of my experience with my students was something we both enjoyed, and I truly felt I was actively modelling positive life learning skills.
Recent Comments